ELK介绍
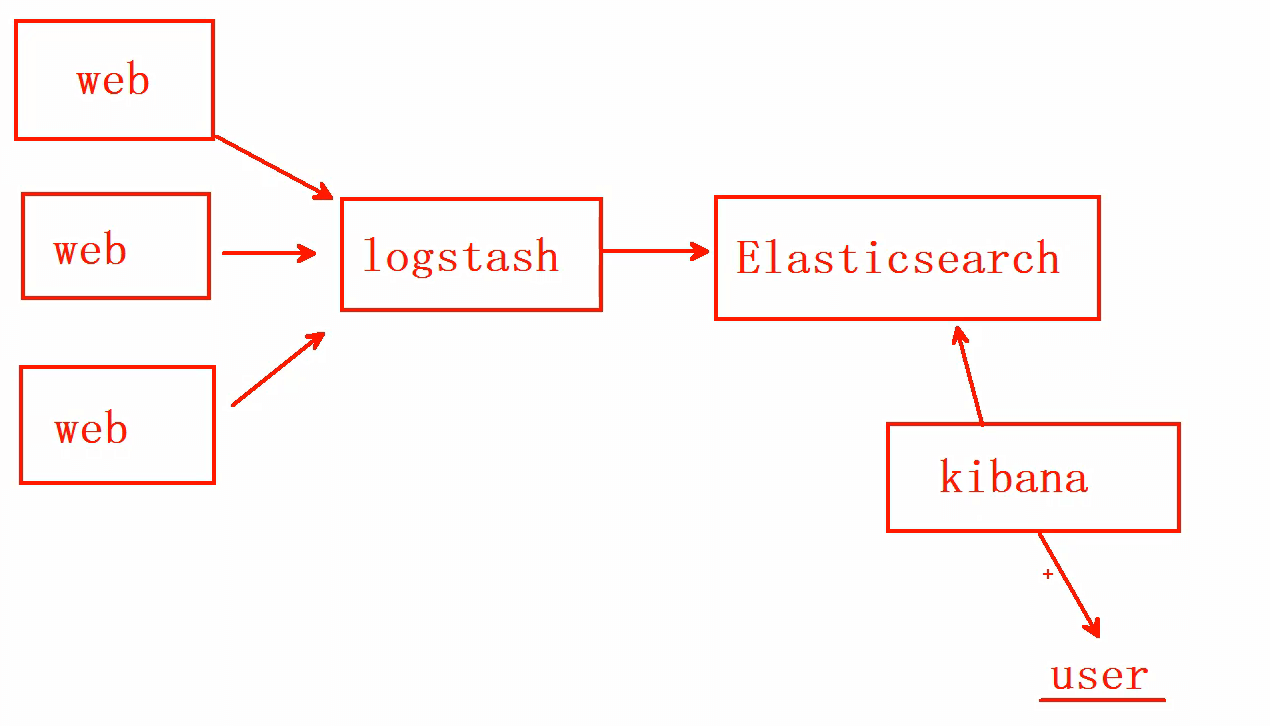
ELK简介
- Elasticsearch:负责日志检索和存储
- Logstash:负责日志的收集和分析、处理
- Kibana:负责日志的可视化
- ELK是一整套解决方案,是三个软件产品的首字母缩写,很多公司都在使用,如:Sina、携程、华为、美团等
- 这三款软件都是开源软件,通常是配合使用,而且又先后归于Elastic.co公司名下,故被简称为ELK
ELK作用
ELK组件在海量日志系统的运维中,可用于:
分布式日志数据集中式查询和管理
系统监控,包含系统硬件和应用各个组件的监控
故障排查
安全信息和事件管理
报表功能
节点规划
| ip地址 |
主机名 |
配置 |
| 192.168.1.41 |
es1 |
2cpu 1.5G |
| 192.168.1.42 |
es2 |
2cpu 1.5G |
| 192.168.1.43 |
es3 |
2cpu 1.5G |
| 192.168.1.44 |
es4 |
2cpu 1.5G |
| 192.168.1.45 |
es5 |
2cpu 1.5G |
| 192.168.1.100 |
yum |
1cpu 1G |
Elasticsearch安装部署
Elasticsearch介绍
- Elasticsearch是一个基于Lucene的搜索服务器。它提供了一个分布式多用户能力的全文搜索引擎,基于RESTful API的Web接口
- Elasticsearch是用Java开发的,使用Apache许可条款的开源软件,是当前流行的企业级搜索引擎。设计用于云计算中,能够达到实时搜索,稳定,可靠,快速,安装使用方便
Elasticsearch特点
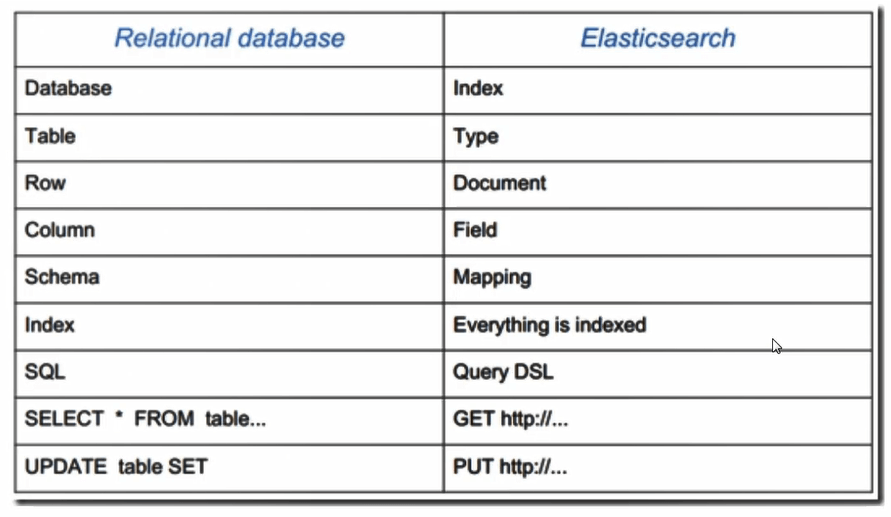
相关概念
|
|
| Node |
装有一个ES服务器的节点 |
| Cluster |
有多个Node组成的集群 |
| Document |
一个可被搜索的基础信息单元 |
| Index |
拥有相似特性的文档的集合 |
| Type |
一个索引中可以定义一种或多种类型 |
| Filed |
是ES的最小单位,相当于数据的某一列 |
| Shards |
索引的分片,每一个分片就是一个Shard |
| Replicas |
索引的拷贝 |
安装Elasticsearch
1
2
3
4
5
6
7
8
9
10
11
12
13
14
15
16
17
18
19
| [root@yum ~]# yum install httpd createrepo -y
[root@yum ~]# mkdir -p /var/www/html/{centos,elk}
[root@yum ~]# mount CentOS-7.5-1804.iso /var/www/html/centos
# 把elk的rpm包拷贝到elk目录
[root@yum ~]# cp -r elk /var/www/html/
[root@yum ~]# cd /var/www/html/elk/
[root@yum elk]# createrepo .
# 把yum源拷贝给其他主机
[root@yum ~]# vi /etc/yum.repos.d/local.repo
[centos]
name=cenots
baseurl=http://192.168.1.100/centos
gpgcheck=0
[elk]
name=elk
baseurl=http://192.168.1.100/elk
gpgcheck=0
|
Elasticsearch单机安装
1
| [root@es1 ~]# yum install java-1.8.0-openjdk elasticsearch -y
|
1
2
3
4
5
6
7
8
9
10
11
12
13
14
15
16
17
18
19
20
21
22
23
24
25
26
27
28
| [root@es1 ~]# vim /etc/elasticsearch/elasticsearch.yml
network.host: 0.0.0.0 # 添加
[root@es1 ~]# systemctl enable --now elasticsearch.service
[root@es1 ~]# ss -lunt
Netid State Recv-Q Send-Q Local Address:Port Peer Address:Port
tcp LISTEN 0 128 :::9200 :::*
tcp LISTEN 0 128 :::9300 :::*
[root@es1 ~]# curl http://192.168.1.41:9200/
{
"name" : "F1PY2vr",
"cluster_name" : "elasticsearch",
"cluster_uuid" : "1eReKXkiRNC7QZBlnY1YNw",
"version" : {
"number" : "6.8.8",
"build_flavor" : "default",
"build_type" : "rpm",
"build_hash" : "2f4c224",
"build_date" : "2020-03-18T23:22:18.622755Z",
"build_snapshot" : false,
"lucene_version" : "7.7.2",
"minimum_wire_compatibility_version" : "5.6.0",
"minimum_index_compatibility_version" : "5.0.0"
},
"tagline" : "You Know, for Search"
}
|
Elasticsearch集群安装
- 要在所有集群集群上配置/etc/hosts,保证所有节点可以相互ping通
- 集群中所有机器都要安装java-openjdk
- cluster.name集群名称配置要求完全一致
- node.name为当前节点标识,应配置本机的主机名
- discovery为集群节点集群,不需要全部配置
- 注意启动顺序
1
2
3
4
5
6
7
8
9
10
11
12
13
14
15
16
17
18
19
20
21
| yum install elasticsearch -y
vim /etc/elasticsearch/elasticsearch.yml
cluster.name: myelk
node.name: 本机主机名
net.work.host: 0.0.0.0
discovery.seed_hosts: ["es1", "es2", "es3"]
cluster.initial_master_nodes: ["es1", "es2", "es3"]
# es1配置好拷贝给其他主机
[root@es1 ~]# vim /etc/elasticsearch/elasticsearch.yml
cluster.name: myelk
node.name: es1
net.work.host: 0.0.0.0
discovery.zen.ping.unicast.hosts: ["es1", "es2", "es3"]
[root@es1 ~]# for i in es{2..5};do scp /etc/elasticsearch/elasticsearch.yml $i:/etc/elasticsearch/elasticsearch.yml ;done
# 其他主机修改node.name,启动
systemctl enable elasticsearch
systemctl start elasticsearch.service
|
验证集群
1
2
3
4
5
6
7
8
9
10
11
12
13
14
15
16
17
18
19
| [root@es1 ~]# curl http://es1:9200/_cluster/health?pretty
{
"cluster_name" : "myelk",
"status" : "green",
"timed_out" : false,
"number_of_nodes" : 5,
"number_of_data_nodes" : 5,
"active_primary_shards" : 0,
"active_shards" : 0,
"relocating_shards" : 0,
"initializing_shards" : 0,
"unassigned_shards" : 0,
"delayed_unassigned_shards" : 0,
"number_of_pending_tasks" : 0,
"number_of_in_flight_fetch" : 0,
"task_max_waiting_in_queue_millis" : 0,
"active_shards_percent_as_number" : 100.0
}
|
返回字段解析
status: “green” 集群状态,绿色为正常,黄色表示有问题但不严重,红色表示严重故障
number_of_nodes: 5
number_of_data_nodes: 5 表示集群中节点的数量
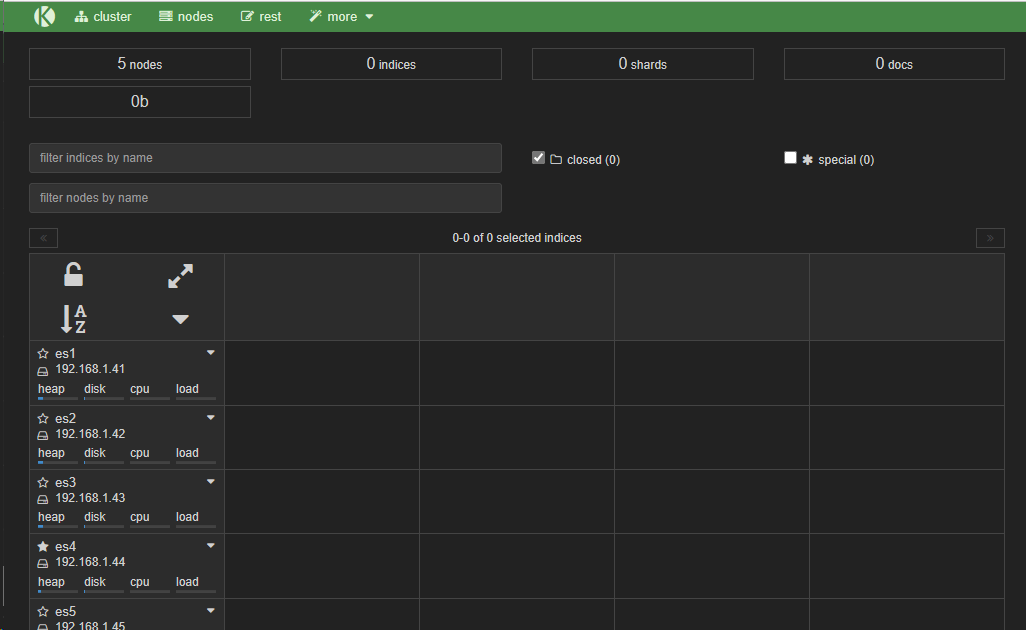
Elasticsearch插件使用
Elasticsearch插件
kopf插件
是一个ElasticSearch的管理工具
它提供了对ES集群操作的API
bigdesk插件
是elasticsearch的一个集群监控工具
可以通过它来查看es集群的各种状态,如:cpu、内存使用情况,索引数据、搜索情况,http连接数等
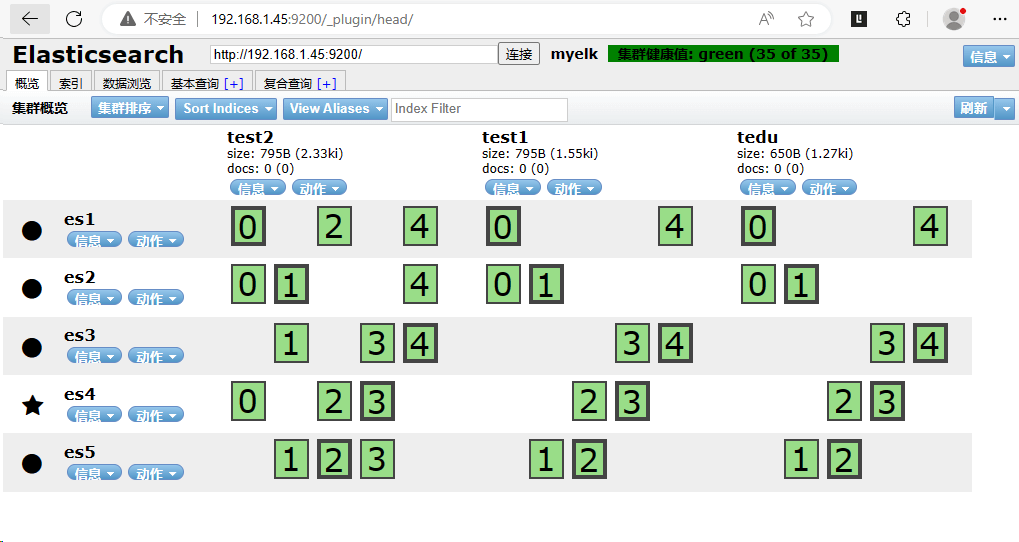
head插件
它展现ES集群的拓扑结构,并且可以通过它来进行索引(Index)和节点(node)级别的操作
它提供了一组针对集群的查询API,并将结果以json和表格形式返回
它提供一些快捷菜单,用以展现集群的各种状态
插件命令
/usr/share/elasticsearch/bin/plugin
查看安装的插件
./plugin list
安装插件
./plugin install http://192.168.1.100/head-xxx-xxx.zip
./plugin install file://tmp/kopf-xx-xx.zip
插件下载地址GitHub - remembertr/elasticsearch–
1
2
3
4
5
6
7
8
9
10
11
12
13
14
15
16
17
18
19
20
21
22
23
24
| # 准备插件
[root@yum ~]# ll
-rw-r--r--. 1 root root 274341 7月 6 16:43 bigdesk-master.zip
-rw-r--r--. 1 root root 899857 7月 6 16:43 elasticsearch-head-master.zip
-rw-r--r--. 1 root root 2228148 7月 6 16:43 elasticsearch-kopf-master.zip
[root@yum ~]# mv *.zip /var/www/html/elk/
# 安装插件
[root@es5 ~]# cd /usr/share/elasticsearch/bin/
[root@es5 bin]# curl -o /tmp/bigdesk-master.zip http://192.168.1.100/elk/bigdesk-master.zip
[root@es5 bin]# curl -o /tmp/elasticsearch-head-master.zip http://192.168.1.100/elk/elasticsearch-head-master.zip
[root@es5 bin]# curl -o /tmp/elasticsearch-kopf-master.zip http://192.168.1.100/elk/elasticsearch-kopf-master.zip
[root@es5 bin]# ./plugin install file:///tmp/bigdesk-master.zip
[root@es5 bin]# ./plugin install file:///tmp/elasticsearch-kopf-master.zip
[root@es5 bin]# ./plugin install file:///tmp/elasticsearch-head-master.zip
# 查看安装情况
[root@es5 bin]# ./plugin list
Installed plugins in /usr/share/elasticsearch/plugins:
- bigdesk
- kopf
- head
|
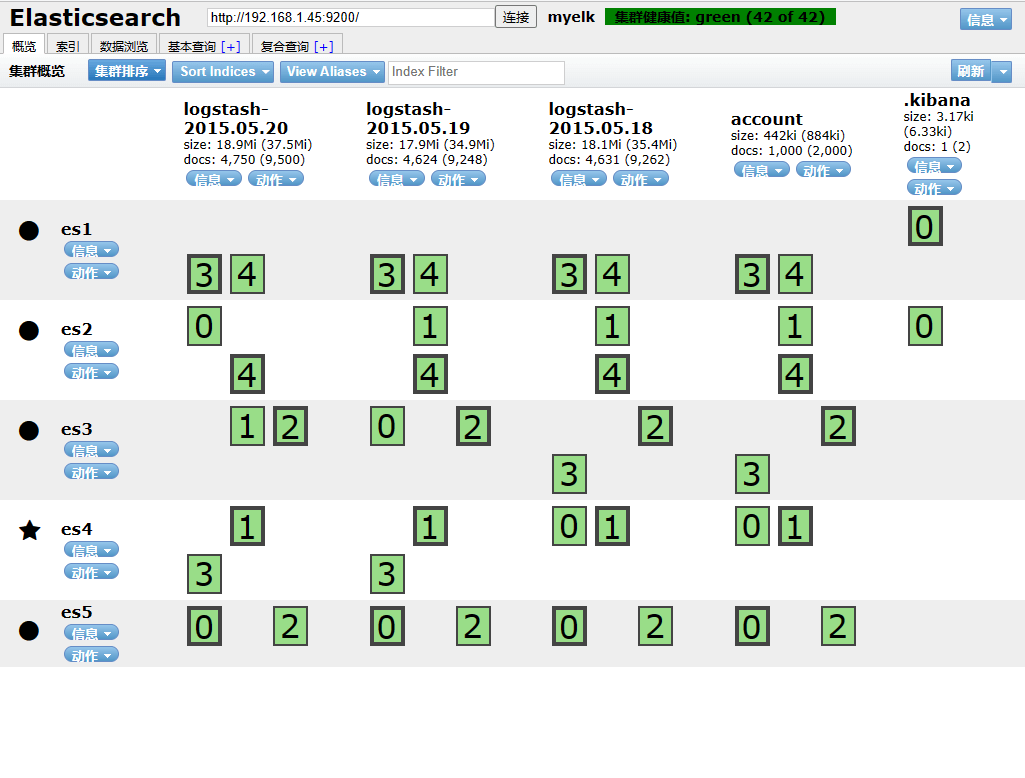
访问插件
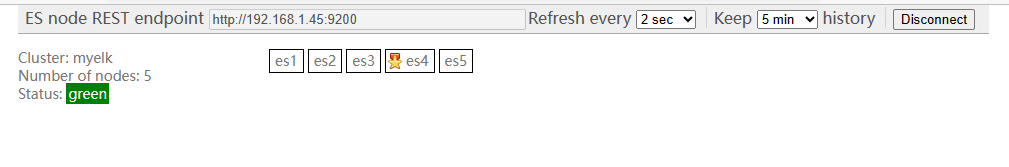
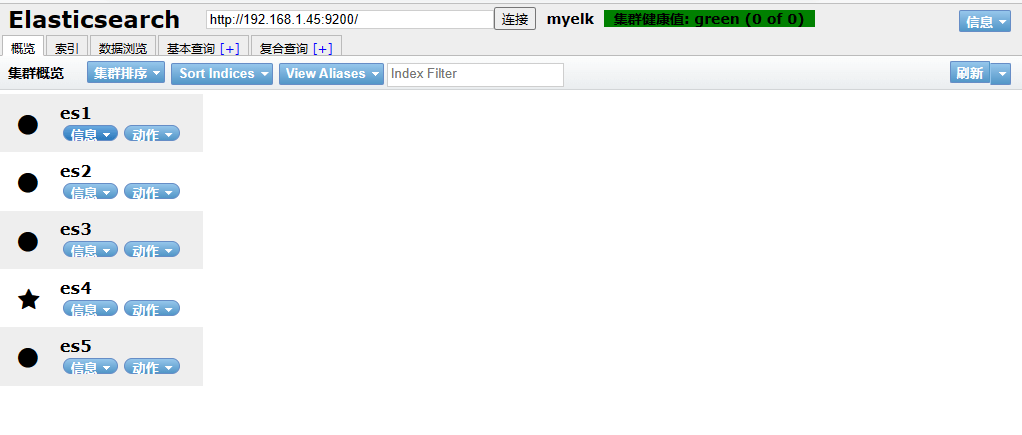
Elasticsearch API简介
RESTful API
Elasticsearch是用http协议访问
http由三部分组成
分别是:请求行、消息报头、请求正文
请求行:Method Request-URL HTTP-Version CRLF
http请求方式
常用方法GET、POST、HEAD
其他方法OPTIONS、PUT、DELETE、TRACE和CONNECT
与elasticsearch交互的数据需使用json格式
Elasticsearch使用的请求方法
PUT:增
DELETE:删
POST:改
GET:查
Curl命令
在linux中curl是一个利用URL规则在命令行下工作的文件传输工具可以说是一款很强大的http命令行工具。
它支持多种请求模式,自定义请求头等强大功能,是一款综合工具
API查询
1
2
3
4
5
6
7
8
9
10
11
12
13
14
15
16
17
| # 查询master信息(?v表示列出详细信息)
[root@yum ~]# curl -XGET http://es1:9200/_cat/master?v
id host ip node
2oKeT09mR8Sc7xLk8VOKZw 192.168.1.44 192.168.1.44 es4
# 查询集群健康
[root@yum ~]# curl -XGET http://es1:9200/_cat/health?v
epoch timestamp cluster status node.total node.data shards pri relo init unassign pending_tasks max_task_wait_time active_shards_percent
1688649833 21:23:53 myelk green 5 5 25 10 0 0 0 0 - 100.0%
# 查询集群节点
[root@yum ~]# curl -XGET http://es1:9200/_cat/nodes
192.168.1.41 192.168.1.41 7 43 0.00 d m es1
192.168.1.45 192.168.1.45 12 44 0.05 d m es5
192.168.1.43 192.168.1.43 6 42 0.00 d m es3
192.168.1.42 192.168.1.42 6 42 0.00 d m es2
192.168.1.44 192.168.1.44 5 43 0.00 d * es4
|
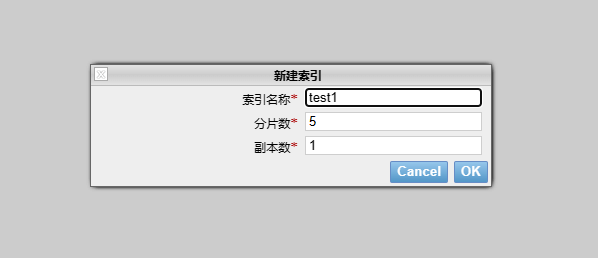
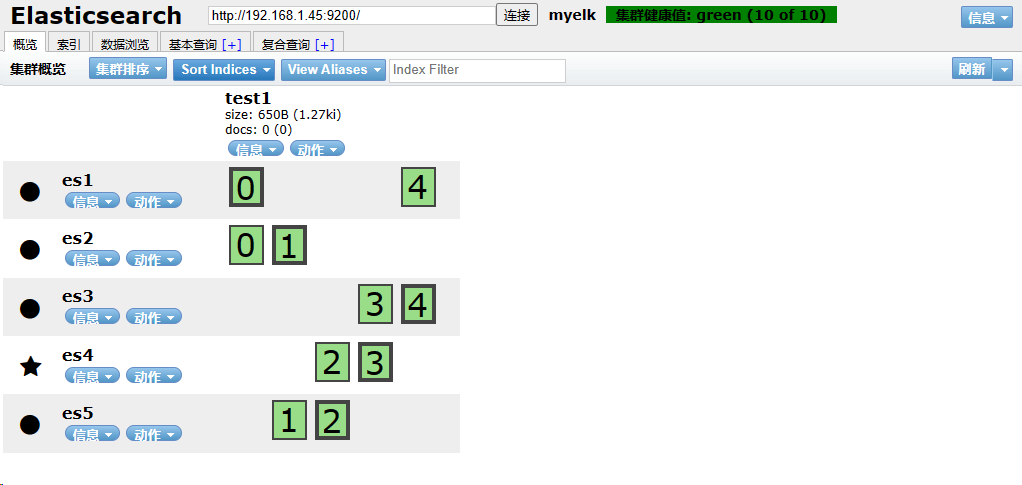
创建索引
1
2
3
4
5
6
7
| curl -XPUT 'http:
"settings":{
"index":{
"number_of_shards":5,"number_of_replicas":1
}
}
}'
|
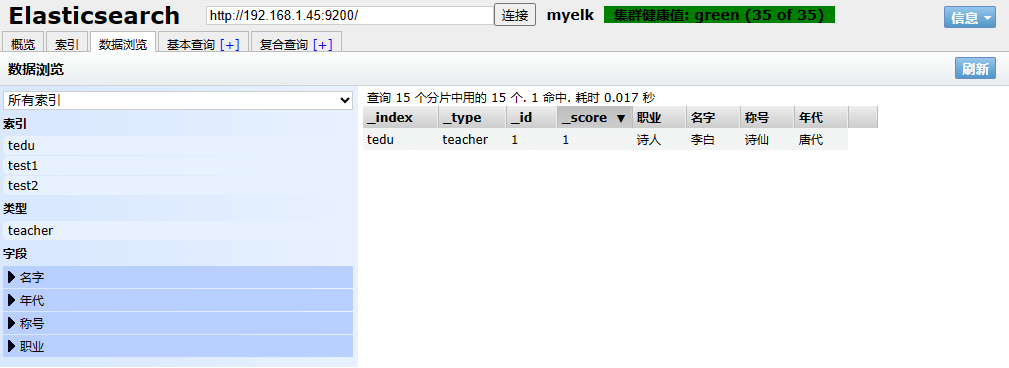
API使用
1
2
3
4
5
6
| curl -XPUT 'http:
"职业":"诗人",
"名字":"李白",
"称号":"诗仙",
"年代":"唐"
}'
|

1
2
3
| curl -XPOST 'http:
"doc":{"年代":"唐代"}
}'
|
Kibana安装部署
介绍
Kibana是什么
数据可视化平台工具
特点
灵活的分析和可视化平台
实时总结流量和数据的图表
为不同的用户显示直观的界面
即时分享和嵌入的仪表盘
安装
- 新建一台机器(也可以用yum那台主机)
- 配置/etc/hosts
- kibana默认安装在/opt/kibana下面
- 配置文件在/opt/kibana/config/kibana.yml
1
2
3
4
5
6
7
8
9
10
11
12
13
14
| [root@kibana ~]# yum install -y kibana
[root@kibana ~]# vim /opt/kibana/config/kibana.yml
server.port: 5601
server.host: "0.0.0.0"
elasticsearch.url: "http://es1:9200"
kibana.index: ".kibana"
kibana.defaultAppId: "discover"
elasticsearch.pingTimeout: 1500
elasticsearch.requestTimeout: 30000
elasticsearch.startupTimeout: 5000
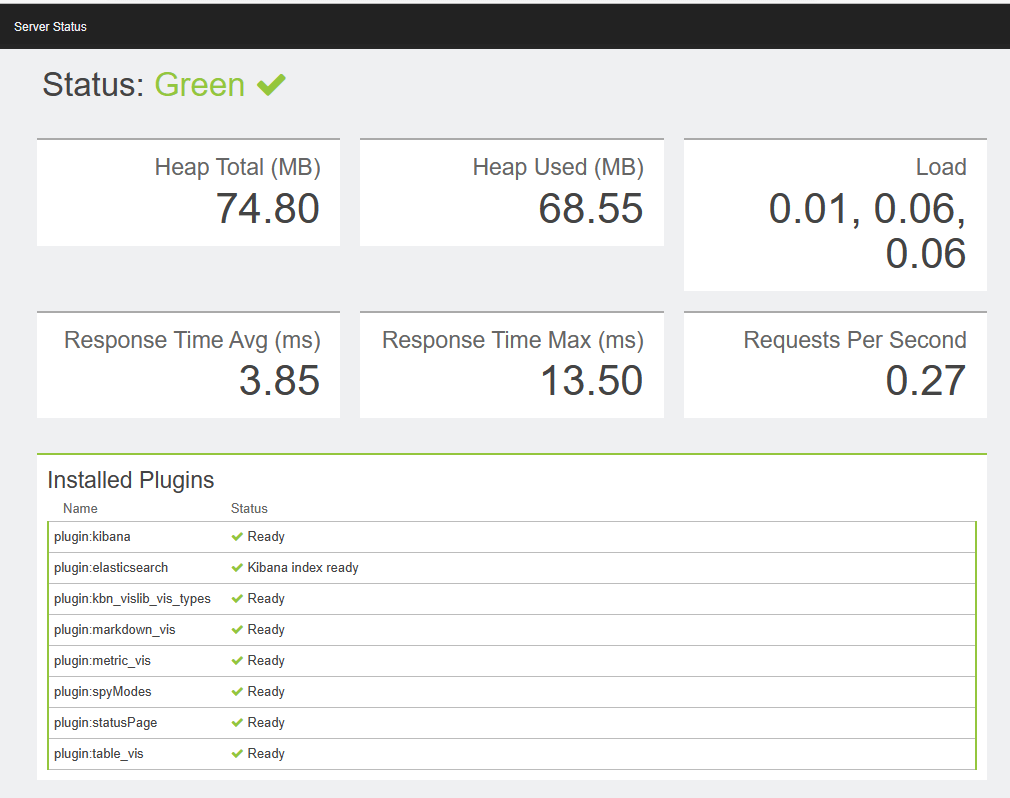
[root@kibana ~]# systemctl enable --now kibana.service
[root@kibana ~]# ss -luntp | grep 5601
tcp LISTEN 0 128 *:5601 *:* users:(("node",pid=2195,fd=10))
|
数据批量导入
1
2
3
4
5
6
| [root@kibana ~]# ll |grep .gz
-rw-r--r--. 1 root root 57105 7月 7 10:14 accounts.json.gz
-rw-r--r--. 1 root root 8705693 7月 7 10:14 logs.jsonl.gz
[root@kibana ~]# curl -XPOST http://es1:9200/account/user/_bulk --data-binary @accounts.json
[root@kibana ~]# curl -XPOST http://es1:9200/_bulk --data-binary @logs.jsonl
|
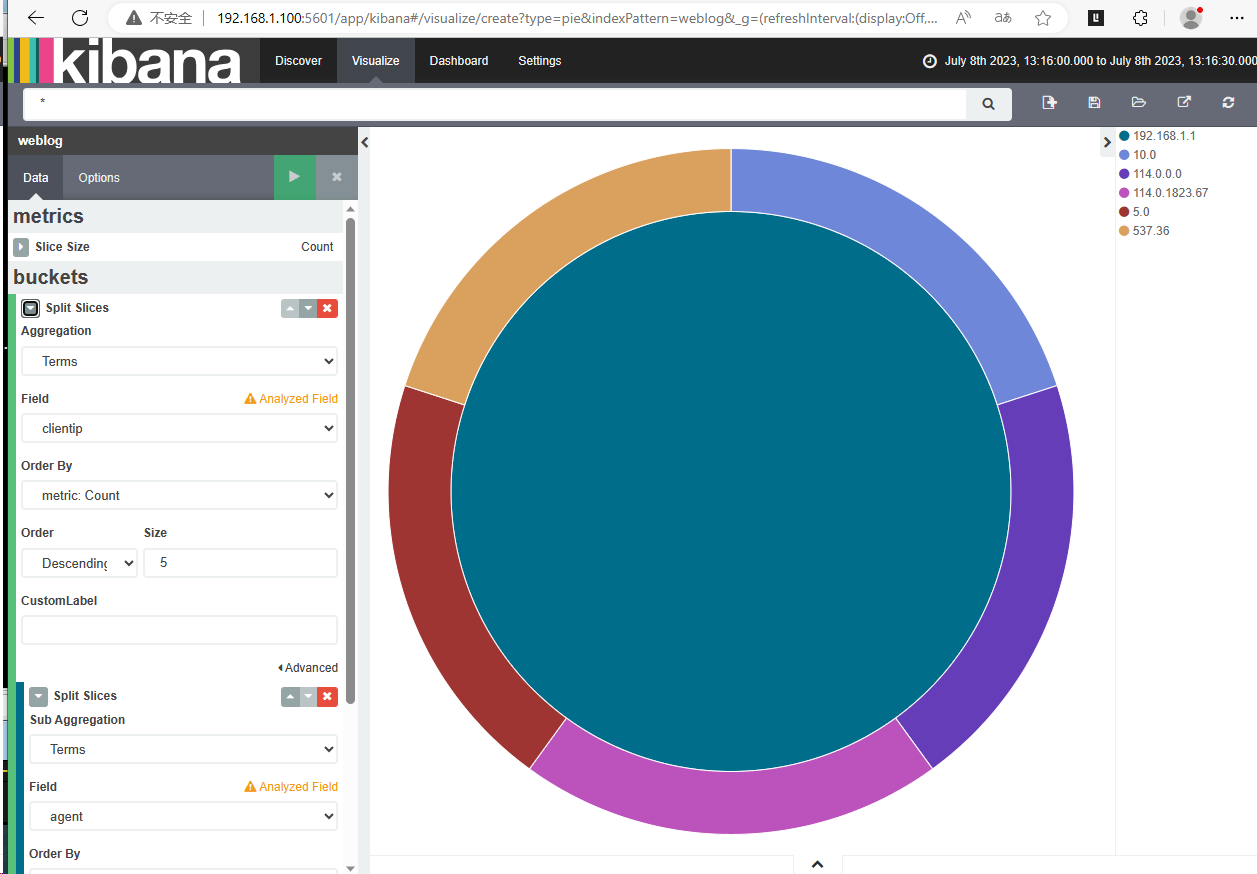
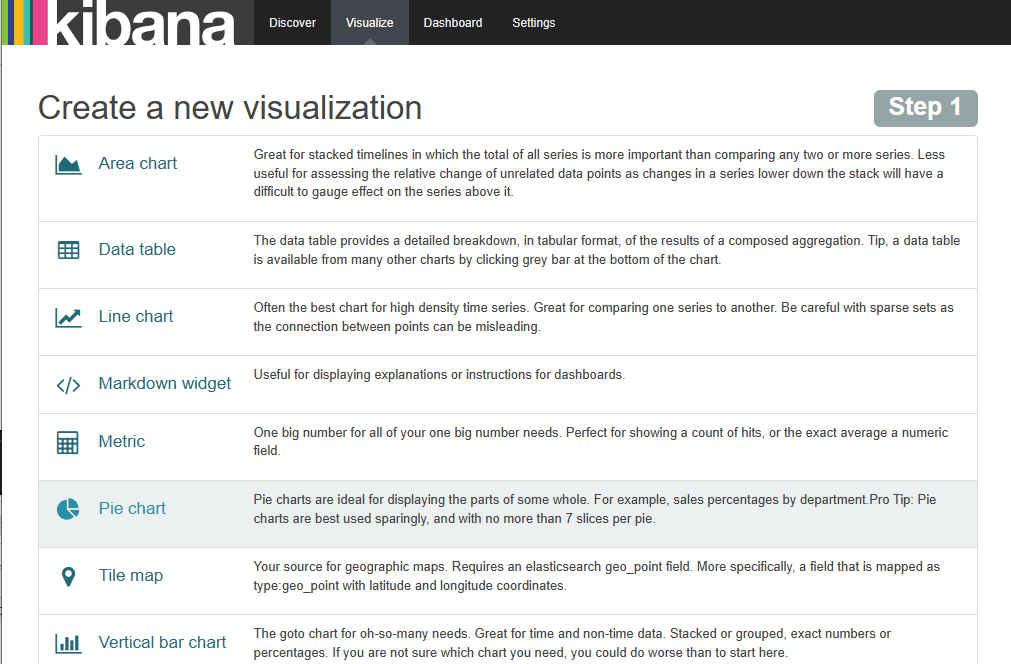
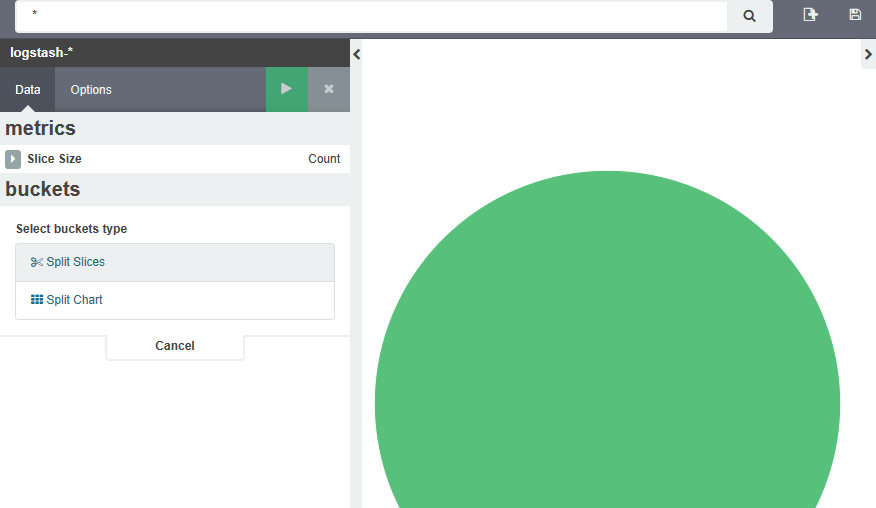
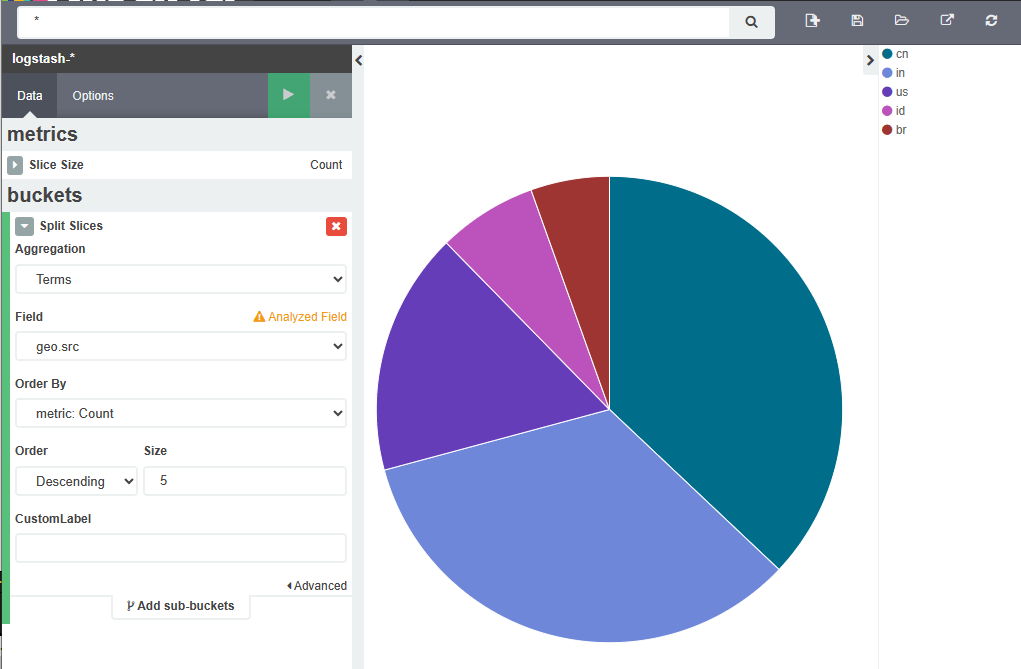
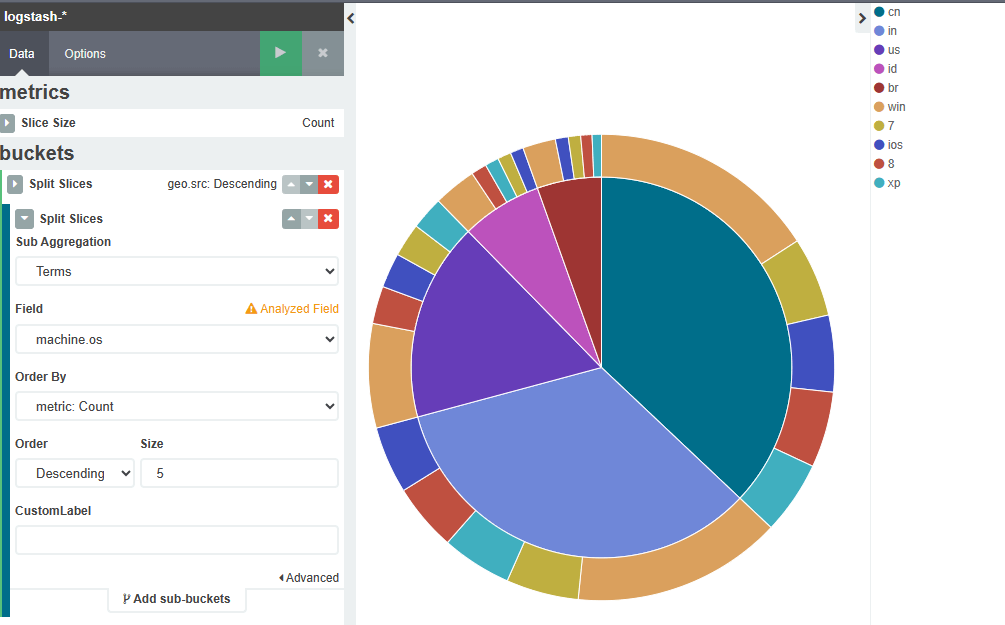
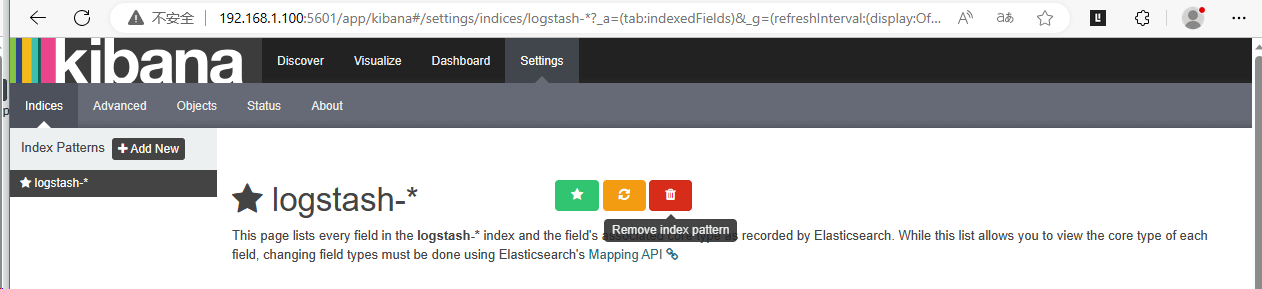
Kibana绘制图表
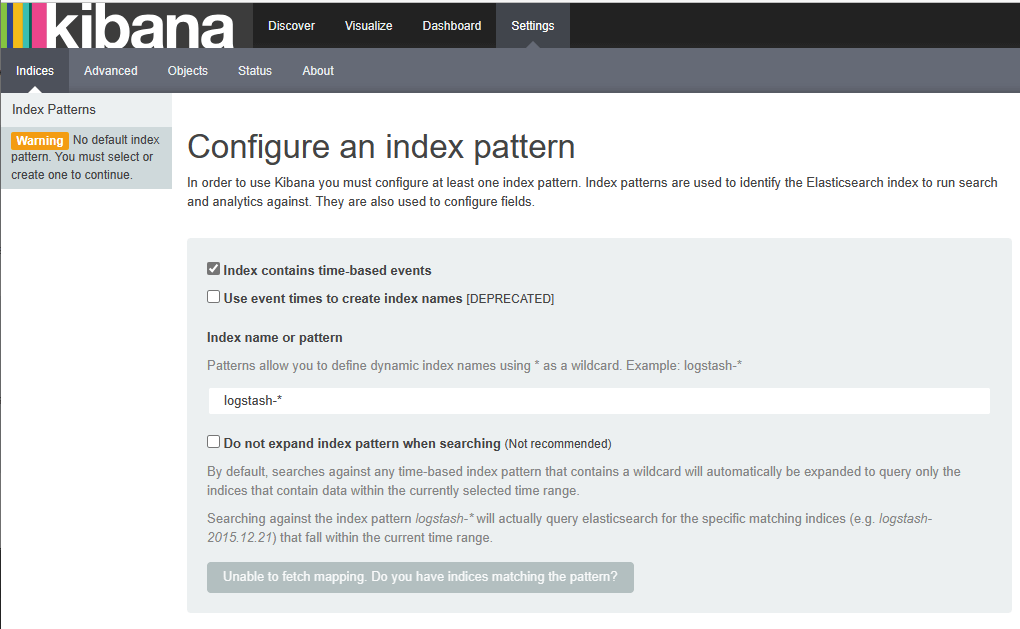
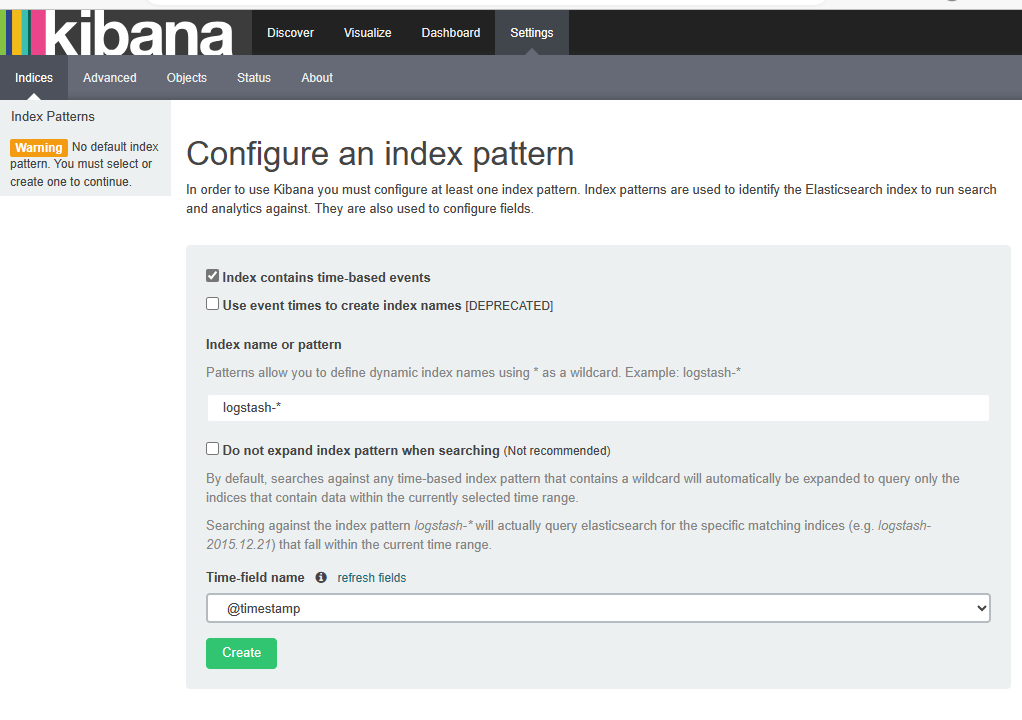
索引选择
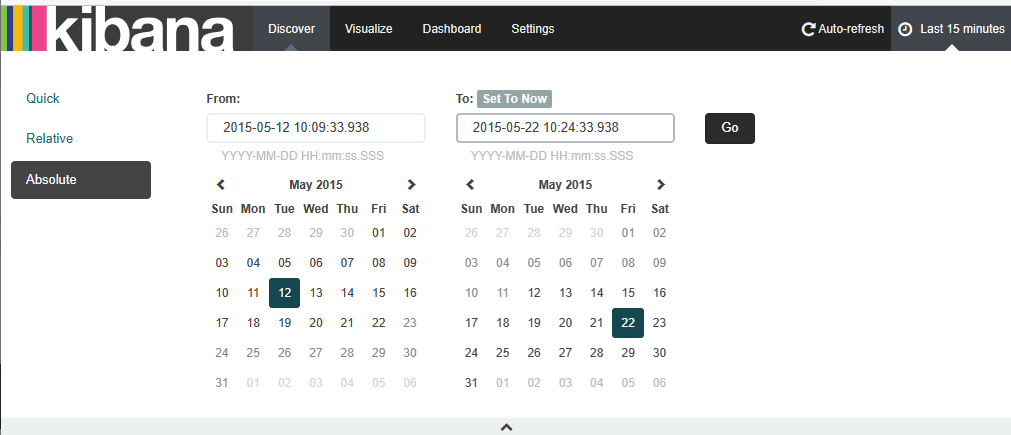
修改时间

logstash安装部署
介绍
logstash
是一个数据采集,加工处理以及传输的工具
特点
所有类型的数据集中处理
不同模式和格式数据的正常化
自定义日志格式的迅速扩展
为自定义数据源轻松添加插件
Logstash工作结构
1
2
3
4
5
| {数据源}==>
input{ }==>
filter{ }==>
output{ }==>
{输出结果} elasticsearch
|
logstash配置文件语法
logstash里面的类型
布尔值类型:ssl_enable=>true
字节类型:bytes=>”1MiB”
字符串类型:name=>”xkops”
数值类型:port=>22
数组:match=>[“datetime”,”UNIX”]
哈希:options=>{k=>”v”,k2=>”v2”}
编码解码:codec=>”json”
路径:file_path=>”/tmp/filename”
注释:#
logstash条件判断
- 等于:==
- 不等于:!=
- 小于:<
- 大于:>
- 小于等于:<=
- 大于等于:>=
- 匹配正则:=~
- 不匹配正则:!~
- 包含:in
- 不包含:not in
- 与:and
- 或:or
- 非与:nand
- 非或:xor
logstash安装
- logstash以来java环境,需要安装java-openjdk
- logstash没有默认的配置文件,需要手动配置
- logstash安装在/opt/logstash目录下
- 配置hosts文件
1
2
| # 创建一台新的机器
[root@logstash ~]# yum install java-1.8.0-openjdk logstash -y
|
logstash配置文件
1
2
3
4
5
6
7
8
9
10
11
12
13
14
15
16
17
18
19
20
21
22
23
24
25
26
27
28
29
30
31
32
33
34
35
36
37
38
39
40
41
42
43
44
45
46
47
48
49
50
51
52
53
54
| [root@logstash ~]# vim /etc/logstash/logstash.conf
input {
stdin{} # 标准输入,数据源来自鼠标键盘
}
filter{ } # 不对数据做处理
output{
stdout{} # 标准输出,输出在显示器
}
# 测试配置文件
[root@logstash ~]# cd /opt/logstash/bin/
[root@logstash bin]# ./logstash -f /etc/logstash/logstash.conf
# 此时终端被占用,可以直接输入任意数据,回车后输出在显示器
# 列出插件
[root@logstash bin]# ./logstash-plugin list
# 修改配置文件使其支持json数据
[root@logstash ~]# vim /etc/logstash/logstash.conf
input {
stdin{ codec => "json" }
}
filter{ }
output{
stdout{ codec => "rubydebug" }
}
[root@logstash bin]# ./logstash -f /etc/logstash/logstash.conf
Settings: Default pipeline workers: 2
Pipeline main started
1aeawtre
{
"message" => "1aeawtre",
"tags" => [
[0] "_jsonparsefailure"
],
"@version" => "1",
"@timestamp" => "2023-07-07T08:29:40.602Z",
"host" => "logstash"
}
{"a":1,"b":2,"c":3}
{
"a" => 1,
"b" => 2,
"c" => 3,
"@version" => "1",
"@timestamp" => "2023-07-07T08:30:08.287Z",
"host" => "logstash"
}
|
上面配置文件使用了logstash-input-stdin、logstash-output-stdout、logstash-codec-json、logstash-codec-rubydebug插件
插件管理/opt/logstash/bin/logstash-plugin
插件及文档地址https://github.com/logstash-plugins
运行logstash
1
2
3
4
5
6
7
8
9
10
11
12
13
14
15
16
17
18
19
20
21
22
23
24
25
26
27
28
29
30
31
32
33
34
35
36
37
38
39
40
41
42
43
44
45
46
47
48
49
50
51
52
53
54
55
56
57
58
59
60
61
62
63
64
65
66
67
68
69
70
71
72
73
74
75
76
77
78
79
80
81
82
83
84
85
86
87
88
89
90
91
92
93
94
95
96
97
98
99
100
101
102
103
104
105
106
107
108
109
110
111
112
113
114
115
116
117
118
119
120
121
122
123
124
125
126
127
128
129
130
131
132
133
134
135
136
137
138
139
140
141
142
| [root@logstash ~]# vim /etc/logstash/logstash.conf
input {
stdin{ codec => "json" }
file {
path => ["/tmp/a.log", "/tmp/b.log"]
}
}
filter{ }
output{
stdout{ codec => "rubydebug" }
}
[root@logstash ~]# touch /tmp/{a,b}.log
[root@logstash ~]# ls /tmp/
a.log b.log
[root@logstash ~]# /opt/logstash/bin/logstash -f /etc/logstash/logstash.conf
# 再开一个终端模拟日志写入
[root@logstash tmp]# echo A_${RANDOM} >> a.log # 随机数
# 查看输出结果
{
"message" => "A_6958",
"@version" => "1",
"@timestamp" => "2023-07-07T09:02:32.605Z",
"path" => "/tmp/a.log",
"host" => "logstash"
}
[root@logstash tmp]# echo B_${RANDOM} >> b.log
{
"message" => "B_29163",
"@version" => "1",
"@timestamp" => "2023-07-07T09:03:41.673Z",
"path" => "/tmp/b.log",
"host" => "logstash"
}
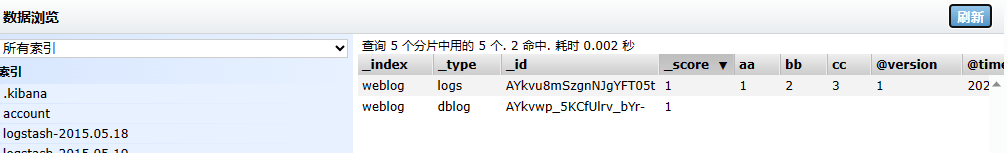
# 发现输出的信息并没有标明数据源来自哪里,给后面处理环节造成很大麻烦
# 通过给不同的数据打标签解决
input {
stdin{ codec => "json" }
file {
path => ["/tmp/a.log"]
type => "weblog"
}
file {
path => ["/tmp/b.log"]
type => "dblog"
}
}
filter{ }
output{
stdout{ codec => "rubydebug" }
}
[root@logstash ~]# /opt/logstash/bin/logstash -f /etc/logstash/logstash.conf
[root@logstash tmp]# echo A_${RANDOM} >> a.log
[root@logstash tmp]# echo B_${RANDOM} >> b.log
{
"message" => "A_11063",
"@version" => "1",
"@timestamp" => "2023-07-07T09:07:50.038Z",
"path" => "/tmp/a.log",
"host" => "logstash",
"type" => "weblog"
}
{
"message" => "B_22005",
"@version" => "1",
"@timestamp" => "2023-07-07T09:07:54.042Z",
"path" => "/tmp/b.log",
"host" => "logstash",
"type" => "dblog"
}
# 当日志已经存在且有数据时
input {
stdin{ codec => "json" }
file {
path => ["/tmp/c.log"]
type => "dblog"
}
}
filter{ }
output{
stdout{ codec => "rubydebug" }
}
[root@logstash tmp]# echo C_${RANDOM} >> c.log
[root@logstash tmp]# echo C_${RANDOM} >> c.log
[root@logstash tmp]# cat c.log
C_30751
C_16817
# 会发现,程序并不会把已存在数据读出来
[root@logstash ~]# /opt/logstash/bin/logstash -f /etc/logstash/logstash.conf
# 设置默认行为,从头读取
input {
stdin{ codec => "json" }
file {
path => ["/tmp/c.log"]
type => "dblog"
start_position => "beginning" # 第一次启动默认行为
sincedb_path => "/var/lib/logstash/sincedb" # 记住上次读到哪里,下次从这开始
}
}
filter{ }
output{
stdout{ codec => "rubydebug" }
}
# 运行程序,可以读取原有数据
[root@logstash ~]# /opt/logstash/bin/logstash -f /etc/logstash/logstash.conf
Settings: Default pipeline workers: 2
Pipeline main started
{
"message" => "C_30751",
"@version" => "1",
"@timestamp" => "2023-07-07T09:17:48.857Z",
"path" => "/tmp/c.log",
"host" => "logstash",
"type" => "dblog"
}
{
"message" => "C_16817",
"@version" => "1",
"@timestamp" => "2023-07-07T09:17:48.916Z",
"path" => "/tmp/c.log",
"host" => "logstash",
"type" => "dblog"
}
|
数据入库output配置
准备一台web服务器apache(192.168.1.48)
安装httpd设置默认页面为hello world
编解码
Elasticsearch插件
1
2
3
4
5
6
7
8
9
10
11
12
13
14
15
16
17
18
19
20
21
22
23
24
25
26
27
28
29
30
| input {
stdin{ codec => "json" }
file {
path => ["/tmp/c.log"]
type => "dblog"
start_position => "beginning"
sincedb_path => "/var/lib/logstash/sincedb"
}
}
filter{ }
output{
stdout{ codec => "rubydebug" }
elasticsearch {
hosts => ["es1:9200", "es2:9200", "es3:9200", "es4:9200", "es5:9200"]
index => "weblog"
}
}
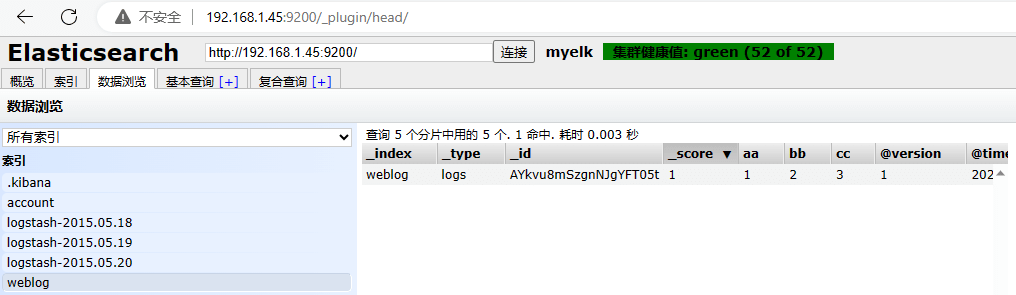
[root@logstash ~]# /opt/logstash/bin/logstash -f /etc/logstash/logstash.conf
{"aa":1, "bb":2, "cc":3}
{
"aa" => 1,
"bb" => 2,
"cc" => 3,
"@version" => "1",
"@timestamp" => "2023-07-07T09:43:02.110Z",
"host" => "logstash"
}
|
把apache服务器一条访问日志,追加进去
1
2
3
4
5
6
| [root@apache ~]# cat /var/log/httpd/access_log
192.168.1.1 - - [07/Jul/2023:16:46:54 +0800] "GET / HTTP/1.1" 200 12 "-" "Mozilla/5.0 (Windows NT 10.0; Win64; x64) AppleWebKit/537.36 (KHTML, like Gecko) Chrome/114.0.0.0 Safari/537.36 Edg/114.0.1823.67"
# 写入c.log
[root@logstash ~]# vim /tmp/c.log
192.168.1.1 - - [07/Jul/2023:16:46:54 +0800] "GET / HTTP/1.1" 200 12 "-" "Mozilla/5.0 (Windows NT 10.0; Win64; x64) AppleWebKit/537.36 (KHTML, like Gecko) Chrome/114.0.0.0 Safari/537.36 Edg/114.0.1823.67"
|
数据分析filter配置
filter过滤
grok插件
解析各种非结构化的日志数据插件
grok使用正则表达式把非结构化的数据结构化再分组匹配
正则表达式需要根据具体的数据结构编写
虽然编写困难,但适用性极广
几乎可以应用于各类数据
配置样例
grok{
match => [ “message”,(?<name>reg), “%{IP:clientip}”]
}
使用宏样例
grok{
match => {“message” => “%{COMBINEDAPACHELOG}”}
}
可使用的表达式宏
/opt/logstash/vendor/bundle/jruby/1.9/gems/logstash-patterns-core-2.0.5/patterns/grok-patterns
复制一条web日志进行匹配分析
小技巧:把日志位置指向/dev/null可以反复读取测试
sincedb_path => “/dev/null”
1
2
3
4
5
6
7
8
9
10
11
12
13
14
15
16
17
18
19
20
21
22
23
24
25
26
27
28
29
30
31
32
33
34
35
36
37
38
39
40
41
42
43
44
45
46
47
48
49
50
51
52
53
54
55
56
57
58
59
60
61
62
63
64
65
66
67
68
69
70
71
72
73
| input {
stdin{ codec => "json" }
file {
path => ["/tmp/c.log"]
type => "dblog"
start_position => "beginning"
#sincedb_path => "/var/lib/logstash/sincedb"
sincedb_path => "/dev/null"
}
}
filter{ }
output{
stdout{ codec => "rubydebug" }
#elasticsearch {
# hosts => ["es1:9200", "es2:9200", "es3:9200"]
# index => "weblog"
#}
}
# 反复执行程序,读取测试,发现每次都能重新读取
input {
stdin{ codec => "json" }
file {
path => ["/tmp/c.log"]
type => "dblog"
start_position => "beginning"
#sincedb_path => "/var/lib/logstash/sincedb"
sincedb_path => "/dev/null"
}
}
filter{
grok {
match => { "message" => "(?<client_ip>([12]?\d?\d\.){3}[12]?\d?\d) (?<rhost>\S+) (?<vber>\S+) \[(?<time>.+)\] \"(?<method>[A-Z]+) (?<url>\S+) (?<proto>[A-Z]+)\/(?<ver>[0-9.]+)\" (?<rc>\d+) (?<size>\d+) \"(?<ref>\S+)\" \"(?<agent>[^\"]+)\"" } # 匹配日志内容
# 也可以使用logstash自带的宏进行匹配
# match => { "message" => "%{COMBINEDAPACHELOG}" }
}
}
output{
stdout{ codec => "rubydebug" }
#elasticsearch {
# hosts => ["es1:9200", "es2:9200", "es3:9200"]
# index => "weblog"
#}
}
[root@logstash ~]# /opt/logstash/bin/logstash -f /etc/logstash/logstash.conf
Settings: Default pipeline workers: 2
Pipeline main started
{
"message" => "192.168.1.1 - - [07/Jul/2023:16:46:54 +0800] \"GET / HTTP/1.1\" 200 12 \"-\" \"Mozilla/5.0 (Windows NT 10.0; Win64; x64) AppleWebKit/537.36 (KHTML, like Gecko) Chrome/114.0.0.0 Safari/537.36 Edg/114.0.1823.67\"",
"@version" => "1",
"@timestamp" => "2023-07-07T12:49:43.610Z",
"path" => "/tmp/c.log",
"host" => "logstash",
"type" => "dblog",
"client_ip" => "192.168.1.1",
"rhost" => "-",
"vber" => "-",
"time" => "07/Jul/2023:16:46:54 +0800",
"method" => "GET",
"url" => "/",
"proto" => "HTTP",
"ver" => "1.1",
"rc" => "200",
"size" => "12",
"ref" => "-",
"agent" => "Mozilla/5.0 (Windows NT 10.0; Win64; x64) AppleWebKit/537.36 (KHTML, like Gecko) Chrome/114.0.0.0 Safari/537.36 Edg/114.0.1823.67"
}
|
filebeat安装配置
filebeat插件
- 由于logstash以来Java环境,而且占用资源非常大,因此在每一台web服务器上部署logstash非常不合适
- 使用更轻量的filebeat替代
- filebeat非常轻量,没有依赖
- filebeat可以通过网络给logstash发送数据
logstash beats插件
1
2
3
4
5
6
7
8
9
10
11
12
13
14
15
16
17
18
19
20
21
22
23
24
25
26
27
28
29
30
31
32
33
34
35
36
37
| [root@logstash ~]# vim /etc/logstash/logstash.conf
input {
stdin{ codec => "json" }
file {
path => ["/tmp/c.log"]
type => "dblog"
start_position => "beginning"
sincedb_path => "/var/lib/logstash/sincedb"
}
beats {
port => 5044
}
}
filter{
grok {
#match => { "message" => "(?<client_ip>([12]?\d?\d\.){3}[12]?\d?\d) (?<rhost>\S+) (?<vber>\S+) \[(?<time>.+)\] \"(?<method>[A-Z]+) (?<url>\S+) (?<proto>[A-Z]+)\/(?<ver>[0-9.]+)\" (?<rc>\d+) (?<size>\d+) \"(?<ref>\S+)\" \"(?<agent>[^\"]+)\"" }
match => { "message" => "%{COMBINEDAPACHELOG}" }
}
}
output{
stdout{ codec => "rubydebug" }
#elasticsearch {
# hosts => ["es1:9200", "es2:9200", "es3:9200"]
# index => "weblog"
#}
}
[root@logstash ~]# /opt/logstash/bin/logstash -f /etc/logstash/logstash.conf
# 打开另一个终端
[root@logstash ~]# ss -luntp | grep 5044
tcp LISTEN 0 50 :::5044 :::* users:(("java",pid=13205,fd=16))
[root@logstash ~]#
|
filebeat安装
web服务器安装filebeat
yum install -y filebeat
设置开机运行/启动服务
systemctl enable filebeat
配置文件
/etc/filebeat/filebeat.yml
paths: # 监控文件路径
-/var/log/*.log # 支持通配符,列表格式,可以有多个
document_type: log # 文档类型,可以传递给logstash
output: # 日志输出配置
logstash: # 输出给logstash,可以是其他的
hosts: [“192.168.1.47:5044”] # logstash地址
1
2
3
4
5
6
7
8
9
10
11
12
13
14
15
16
17
18
19
20
21
22
23
| [root@apache ~]# yum install filebeat -y
[root@apache ~]# systemctl enable filebeat.service
# 修改配置文件
[root@apache ~]# grep -Pv "^\s*(#|$)" /etc/filebeat/filebeat.yml
filebeat:
prospectors:
-
paths:
- /var/log/httpd/access_log
input_type: log
registry_file: /var/lib/filebeat/registry
output:
logstash:
hosts: ["192.168.1.47:5044"]
shipper:
logging:
files:
rotateeverybytes: 10485760 # = 10MB
# logstash程序必须启动
[root@logstash ~]# /opt/logstash/bin/logstash -f /etc/logstash/logstash.conf
[root@apache ~]# systemctl start filebeat.service
|
浏览器访问apache的web页面,查看logstash会发现输出很多日志
声明type是什么类型的日志,需要修改filebeat配置文件
1
2
3
4
5
6
| [root@apache ~]# vim /etc/filebeat/filebeat.yml
document_type: apache_log
[root@apache ~]# systemctl restart filebeat.service
# 再次访问,logstash显示type为apache_log
|
web日志分析实战
目标
访问web服务器,可以通过kibana查看访问情况
步骤1:在web服务器上安装filwbeat,并把日志发送给logstash
步骤2:logstash格式化日志后存入elasticsearch
logstash – input 配置beats收集日志
logstash – filter 对日志格式化
logstash – output 写入日志到elasticsearch
步骤3:kibana从elasticsearch读取日志图表展示
步骤1
1
2
3
4
5
6
7
8
9
| filebeat:
prospects:
-
paths:
- /var/log/httpd/access_log
document_type: apachelog
output:
logstash:
hosts: ["192.168.1.47:5044"]
|
步骤2
1
2
3
4
5
6
| input {
beats {
port => 5044
}
... ...
}
|
1
2
3
4
5
6
7
| filter {
if [type] == "apachelog" {
grok {
match => ["message", "%{COMEINEDAPACHELOG}"]
}}
... ...
}
|
1
2
3
4
5
6
7
8
| output {
if [type] == "apachelog" {
elasticsearch {
hosts => ["es1:9200","es2:9200","es3:9200"]
index => "apachelog"
}}
stdout { codec => "rubydebug" } # 调试成功后关闭
}
|
步骤3
初始化kibana
初始化elasticsearch
1
| [root@es3 ~]# curl -XDELETE http://es5:9200/*
|
初始化web服务器
1
2
3
4
5
6
7
8
9
10
11
12
13
14
15
16
| [root@apache ~]# grep -Pv "^\s*(#|$)" /etc/filebeat/filebeat.yml
filebeat:
prospectors:
-
paths:
- /var/log/httpd/access_log
input_type: log
document_type: apache_log
registry_file: /var/lib/filebeat/registry
output:
logstash:
hosts: ["192.168.1.47:5044"]
shipper:
logging:
files:
rotateeverybytes: 10485760 # = 10MB
|
配置logstash
1
2
3
4
5
6
7
8
9
10
11
12
13
14
15
16
17
18
19
20
21
22
23
24
25
26
27
28
29
30
31
32
33
34
35
36
37
38
39
40
41
42
43
44
45
46
47
48
49
50
51
52
53
54
55
56
57
58
59
60
61
62
63
64
65
66
67
68
69
70
71
72
73
74
75
76
77
78
79
80
81
82
83
84
85
86
87
88
89
90
91
92
93
94
95
96
97
| [root@logstash ~]# vim /etc/logstash/logstash.conf
input {
stdin{ codec => "json" }
file {
path => ["/tmp/c.log"]
type => "dblog"
start_position => "beginning"
sincedb_path => "/var/lib/logstash/sincedb"
}
beats {
port => 5044
}
}
filter{
if [type] == "apache_log" {
grok {
match => { "message" => "%{COMBINEDAPACHELOG}" }
}}
}
output{
stdout{ codec => "rubydebug" }
#if [type] == "apache_log" {
#elasticsearch {
# hosts => ["es1:9200", "es2:9200", "es3:9200"]
# index => "weblog"
#}}
}
[root@logstash ~]# /opt/logstash/bin/logstash -f /etc/logstash/logstash.conf
# 访问apache服务器web页面获取日志
# logstash服务器显示正常
{
"message" => "192.168.1.1 - - [08/Jul/2023:13:13:42 +0800] \"GET / HTTP/1.1\" 304 - \"-\" \"Mozilla/5.0 (Windows NT 10.0; Win64; x64) AppleWebKit/537.36 (KHTML, like Gecko) Chrome/114.0.0.0 Safari/537.36 Edg/114.0.1823.67\"",
"@version" => "1",
"@timestamp" => "2023-07-08T05:13:48.920Z",
"type" => "apache_log",
"count" => 1,
"offset" => 9873,
"input_type" => "log",
"fields" => nil,
"beat" => {
"hostname" => "apache",
"name" => "apache"
},
"source" => "/var/log/httpd/access_log",
"host" => "apache",
"tags" => [
[0] "beats_input_codec_plain_applied"
],
"clientip" => "192.168.1.1",
"ident" => "-",
"auth" => "-",
"timestamp" => "08/Jul/2023:13:13:42 +0800",
"verb" => "GET",
"request" => "/",
"httpversion" => "1.1",
"response" => "304",
"referrer" => "\"-\"",
"agent" => "\"Mozilla/5.0 (Windows NT 10.0; Win64; x64) AppleWebKit/537.36 (KHTML, like Gecko) Chrome/114.0.0.0 Safari/537.36 Edg/114.0.1823.67\""
}
# 修改配置文件
input {
stdin{ codec => "json" }
file {
path => ["/tmp/c.log"]
type => "dblog"
start_position => "beginning"
sincedb_path => "/var/lib/logstash/sincedb"
}
beats {
port => 5044
}
}
filter{
if [type] == "apache_log" {
grok {
match => { "message" => "%{COMBINEDAPACHELOG}" }
}}
}
output{
if [type] == "apache_log" {
elasticsearch {
hosts => ["es1:9200", "es2:9200", "es3:9200"]
index => "weblog"
}}
}
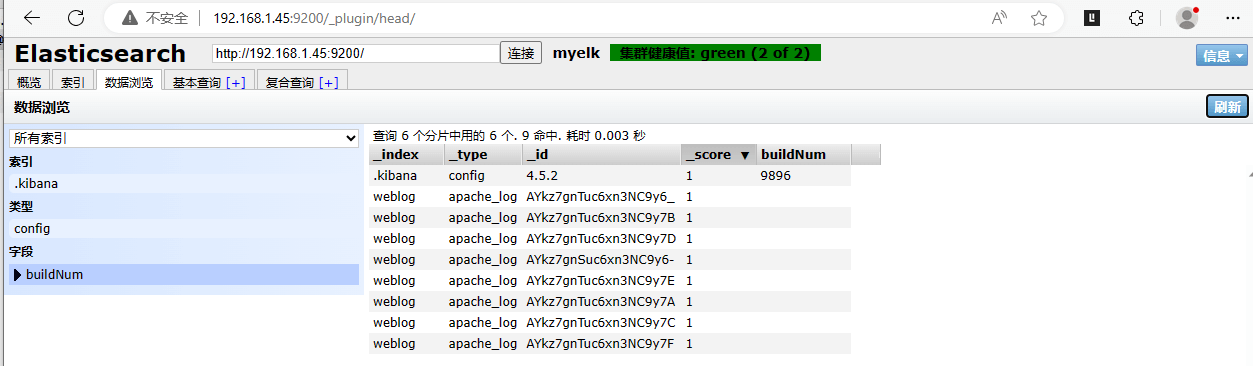
[root@logstash ~]# /opt/logstash/bin/logstash -f /etc/logstash/logstash.conf
# 再次访问web
|
1
2
3
4
| [root@logstash ~]# yum install screen -y
[root@logstash ~]# screen -S admin # 把进程放在后台运行
[root@logstash ~]# /opt/logstash/bin/logstash -f /etc/logstash/logstash.conf
Ctrl+a+d
|
kibana数据导入
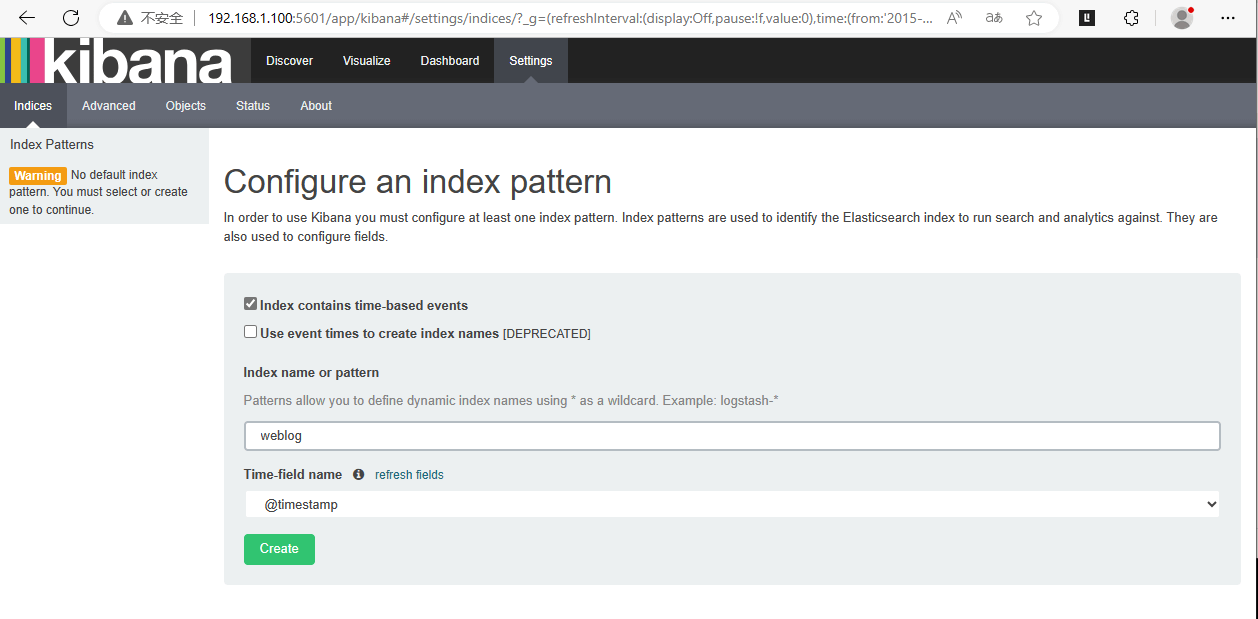
时间别忘了修改为最后15分钟